Key Takeaways
- Ethereum’s price is back near $2,600, but ETH remains roughly 47% below its October 2025 peak.
- Tom Lee sees a $6,000 path if bitcoin hits $150,000 and ETH/BTC climbs back to 0.04.
- Ethereum’s Glamsterdam upgrade is slated for Q4, with Sepolia scheduled for Oct. 6.
Ethereum Is Back, but Not All the Way Back
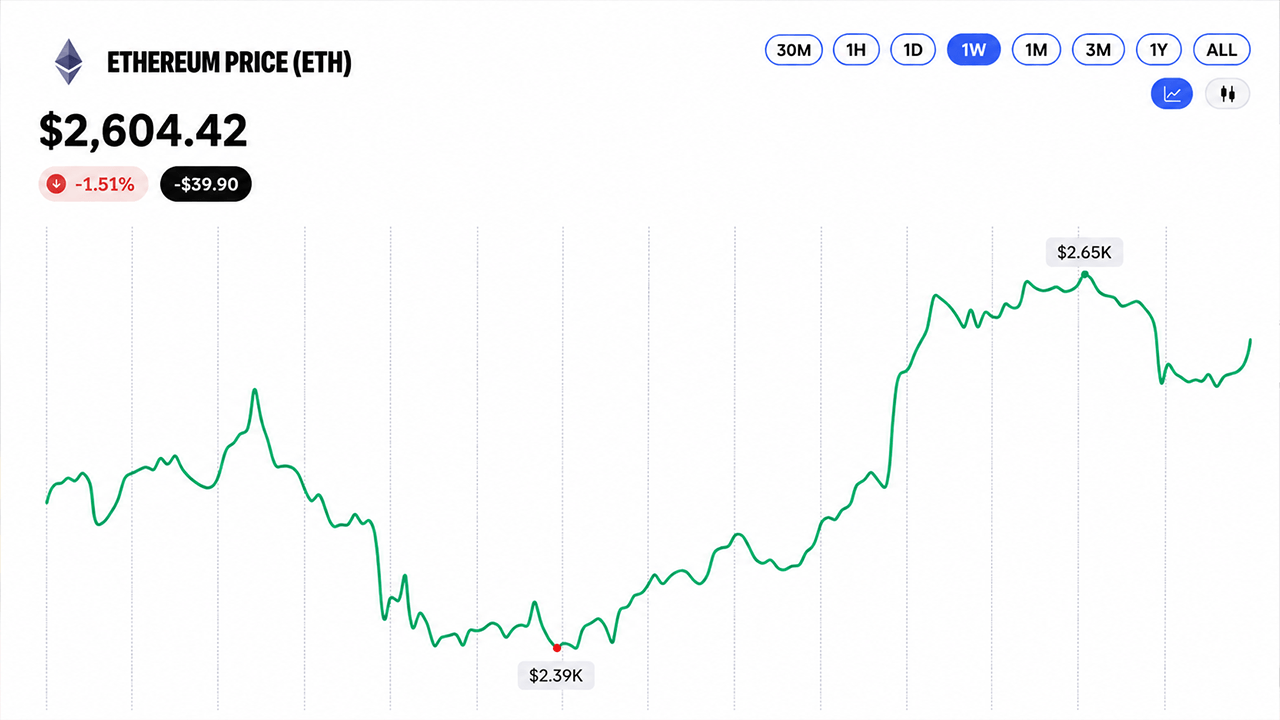
Ethereum’s price has finally given bulls something to work with. After sinking to $2,360.70 around Sept. 16, ETH ripped to $2,668 per coin before cooling around $2,600, reclaiming levels not seen since January. Yet zoom out, and the comeback looks very different. Ether is still about 47% below its October 2025 peak near $4,946, while the ETH/BTC ratio sits near 0.032, miles below its 2021 high around 0.08.
That gap is precisely why the year-end debate has gotten interesting. ETH’s price has spent much of this cycle trailing bitcoin’s (BTC) price, but roughly 35% of its supply is now staked, exchange balances have been falling, and spot ETH ETFs hold around $16.7 billion in assets. After more than $400 million in midweek outflows, roughly $144 million came back on Sept. 18. Demand is there. A stampede, it isn’t.
The $6,000 Math Has a Catch
Fundstrat’s Tom Lee has laid out one of the cleaner bullish paths. If Bitcoin reaches $150,000 and ETH/BTC recovers to 0.04, his math puts ethereum near $6,000 by December. BitMEX founder Arthur Hayes has gone further, making ETH his largest position and floating a speculative $10,000 end-2026 target built around a major liquidity expansion.
Standard Chartered’s Geoff Kendrick sits closer to earth with a $4,000 end-2026 target, while Citi has previously cut a 12-month target as low as $2,240. That leaves Wall Street and crypto’s biggest personalities staring at the same asset and finding radically different destinations.

The strange part is that they’re largely watching the same ingredients. ETF flows need to improve, ETH needs to gain ground against bitcoin, and macro conditions can’t go off the rails. A $6,000-$10,000 ethereum price isn’t simply today’s rally with a few more green candles attached.
First, Ethereum Needs to Beat $3,000
The charts offer a much nearer hurdle. Ethereum is trading above nearly every major daily moving average, including its 50-day SMA at $2,272.50 and 200-day SMA at $2,076.10. But momentum has cooled, with resistance sitting around 2,655-2,668 and another technical zone extending toward $2,672.
A sustained break through that area puts 2,800-3,000 in play. Failure brings $2,400 back into the conversation. In other words, before anyone starts engraving $6,000 on the trophy, ETH still has to prove it can hold the breakout it already has.
Glamsterdam Arrives With the Clock Running
Then comes Glamsterdam. Sepolia is scheduled for Oct. 6, with the Ethereum mainnet upgrade still penciled in for Q4. The fork targets higher throughput, parallel execution, greater blob capacity and changes to how blocks are built. It won’t magically triple ETH, but a clean launch could give the market another reason to revisit Ethereum’s scaling story.
That leaves Q4 with a surprisingly simple scoreboard: 2,550-2,672, ETF flows, ETH/BTC and Glamsterdam. Ethereum has clawed its way back to $2,600. Turning that recovery into $4,000, $6,000 or the much louder $10,000 calls is where the easy part ends.