
x_ = np.linspace(-5, 5, 500)
y_ = np.linspace(-2.2, 2.2, 500)
X, Y = np.meshgrid(x_, y_)
Z = loss(X, Y)
fig = plt.figure(figsize=(16, 10), facecolor=”#FAFAF8″)
gs = GridSpec(2, 3, figure=fig, hspace=0.45, wspace=0.38,
left=0.07, right=0.97, top=0.88, bottom=0.08)
COLORS = {
“gd”: “#E05C4B”,
“mom_good”: “#3A7CA5”,
“mom_large”: “#F4A536”,
“contour”: “#D4C9B8”,
“minima”: “#2A9D5C”,
“start”: “#444444”,
}

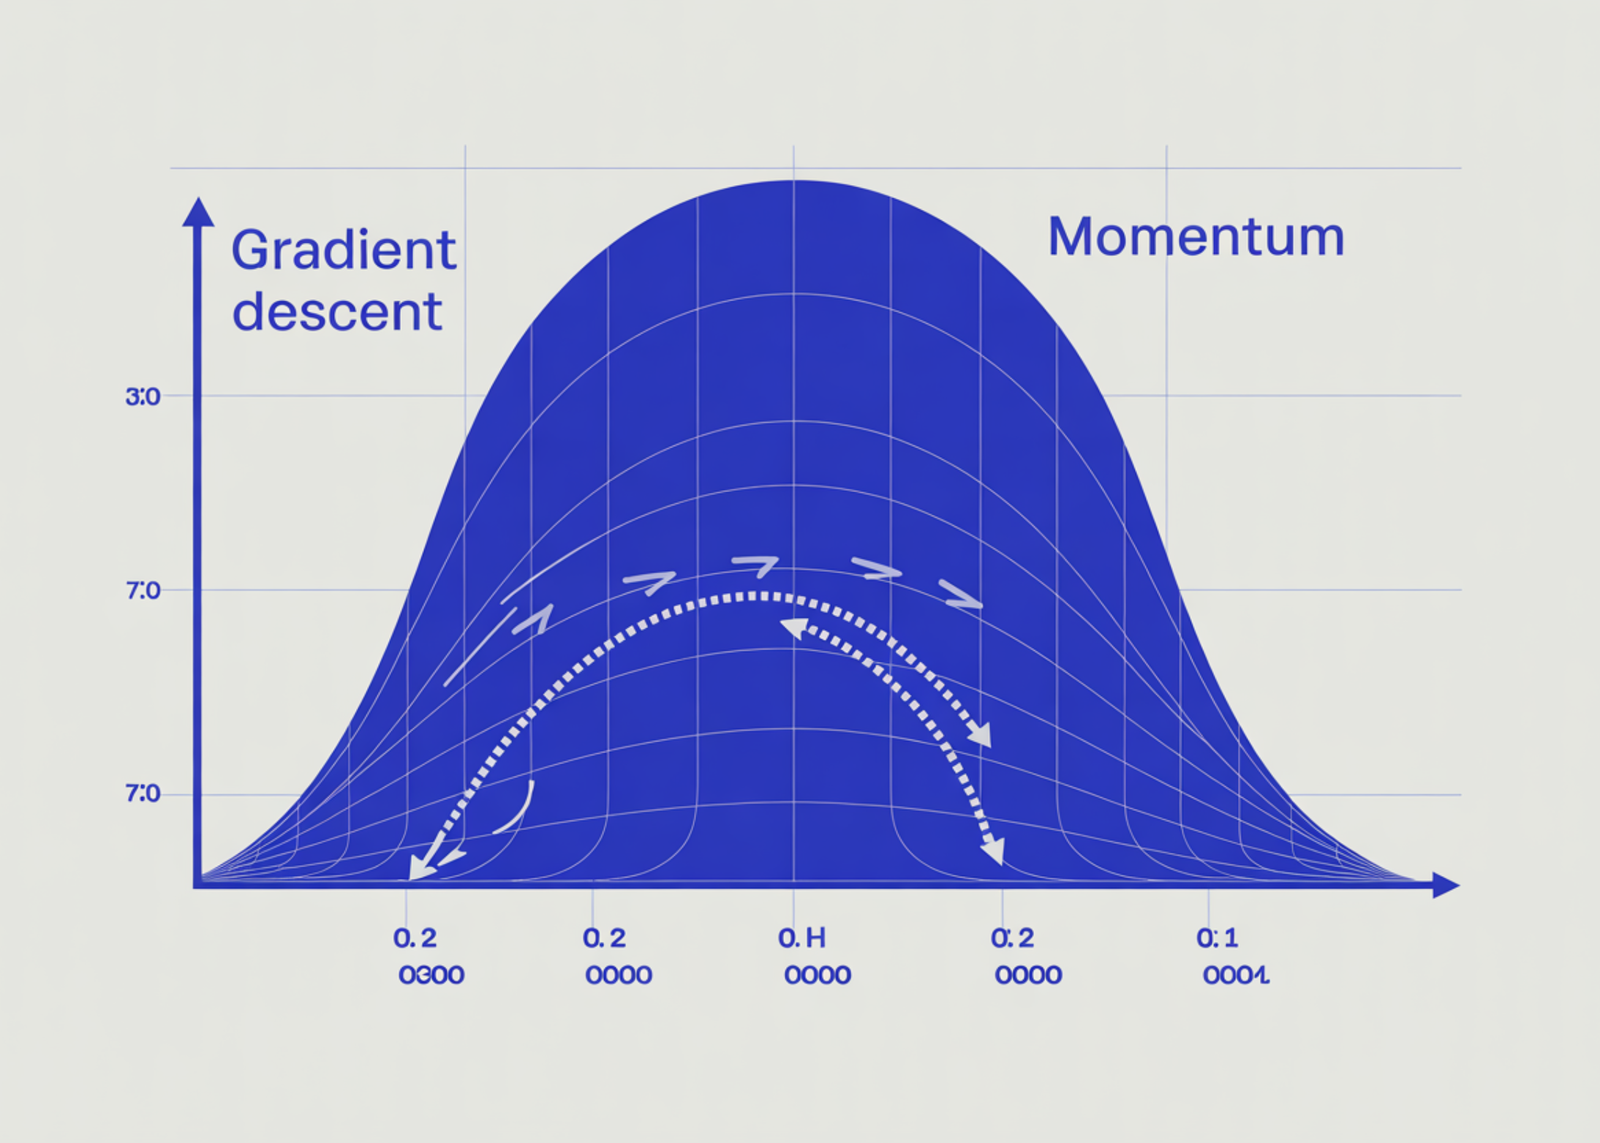
PANEL_TITLES = [
“Vanilla Gradient Descent\nOscillates, slow (185 steps to converge)”,
“Momentum β = 0.90\nSmooth, fast (159 steps to converge)”,
“Momentum β = 0.99 (too large)\nOvershoots — never converges”,
]
paths_plot = [
path_gd[:PLOT_STEPS+1],
path_mom_good[:PLOT_STEPS+1],
path_mom_large[:PLOT_STEPS+1],
]
colors = [COLORS[“gd”], COLORS[“mom_good”], COLORS[“mom_large”]]
# top row: trajectory panels
for col, (path, color, title) in enumerate(zip(paths_plot, colors, PANEL_TITLES)):
ax = fig.add_subplot(gs[0, col])
ax.set_facecolor(“#F5F3EE”)
levels = np.geomspace(0.005, 3.5, 28)
ax.contour(X, Y, Z, levels=levels, colors=COLORS[“contour”],
linewidths=0.7, alpha=0.9)
ax.plot(path[:, 0], path[:, 1], color=color, lw=1.8, alpha=0.85, zorder=3)
ax.scatter(path[:, 0], path[:, 1], color=color, s=18, zorder=4, alpha=0.6)
ax.scatter(*path[0], marker=”o”, s=90, color=COLORS[“start”], zorder=5, label=”start”)
ax.scatter(*path[-1], marker=”*”, s=120, color=COLORS[“minima”], zorder=5, label=”end”)
ax.scatter(0, 0, marker=”+”, s=200, color=COLORS[“minima”], linewidths=2.5, zorder=6)
ax.set_xlim(-5, 5)
ax.set_ylim(-2.2, 2.2)
ax.set_title(title, fontsize=9.5, fontweight=”bold”, color=”#222″, pad=7, loc=”left”)
ax.set_xlabel(“θ₁ (slow direction)”, fontsize=8, color=”#666″)
ax.set_ylabel(“θ₂ (fast direction)”, fontsize=8, color=”#666″)
ax.tick_params(labelsize=7, colors=”#888″)
for spine in ax.spines.values():
spine.set_edgecolor(“#CCCCCC”)
# bottom-left: loss curves (full 300 steps)
ax_loss = fig.add_subplot(gs[1, :2])
ax_loss.set_facecolor(“#F5F3EE”)
full_paths = [path_gd, path_mom_good, path_mom_large]
full_labels = [“Vanilla GD (185 steps)”, “Momentum β=0.90 (159 steps)”, “Momentum β=0.99 (diverges)”]
for path, color, label in zip(full_paths, colors, full_labels):
losses = [loss(*p) for p in path]
steps_range = np.arange(len(path))
ax_loss.plot(steps_range, losses, color=color, lw=2, label=label, alpha=0.9)
ax_loss.axhline(0.001, color=”#999″, lw=1, ls=”–“, alpha=0.6)
ax_loss.text(305, 0.001, “convergence\nthreshold”, fontsize=7, color=”#888″, va=”center”)
ax_loss.set_yscale(“log”)
ax_loss.set_xlim(0, STEPS)
ax_loss.set_title(“Loss vs. Optimisation Step (log scale, 300 steps)”,
fontsize=10.5, fontweight=”bold”, color=”#222″, loc=”left”)
ax_loss.set_xlabel(“Step”, fontsize=9, color=”#666″)
ax_loss.set_ylabel(“Loss f(θ)”, fontsize=9, color=”#666″)
ax_loss.legend(fontsize=8.5, framealpha=0.6)
ax_loss.tick_params(labelsize=8, colors=”#888″)
for spine in ax_loss.spines.values():
spine.set_edgecolor(“#CCCCCC”)
# bottom-right: annotation panel
ax_ann = fig.add_subplot(gs[1, 2])
ax_ann.set_facecolor(“#F5F3EE”)
ax_ann.axis(“off”)
annotation = (
“Update rules\n\n”
“Vanilla GD\n”
” θ ← θ − α·∇L(θ)\n\n”
“Momentum GD\n”
” v ← β·v + (1−β)·∇L(θ)\n”
” θ ← θ − α·v\n\n”
“Key intuition\n”
” v accumulates past gradients.\n”
” Vertical oscillations cancel out.\n”
” Horizontal steps compound.\n\n”
“Hyperparameter β\n”
” β → 0 : behaves like GD\n”
” β = 0.9: typical sweet spot\n”
” β → 1 : overshoots / diverges”
)
ax_ann.text(0.05, 0.97, annotation, transform=ax_ann.transAxes,
fontsize=8.8, va=”top”, ha=”left”,
fontfamily=”monospace”, color=”#333″, linespacing=1.7)
fig.suptitle(“Momentum in Gradient Descent”,
fontsize=16, fontweight=”bold”, color=”#111″, y=0.95)
plt.savefig(“momentum_explainer.png”, dpi=150, bbox_inches=”tight”,
facecolor=fig.get_facecolor())
plt.show()